
|
BY: QUEST You may be wondering what a “molecular simulation” is anyway. We got this for you! Molecular simulations or molecular modeling is a collection of ways for doing “computer experiments” on model systems. Model systems are simplified version of real world cases. Molecular models are guided by the theory and work through the tools of math and physics. But then the scientists end up with equations that are too difficult to solve in a simple and accurate form. Not surprisingly, computers or supercomputers are used for numerical solutions. As you figured by now, this is a very interdisciplinary field and is called molecular modeling or computational chemistry/biology.  In the simplest terms, results from computer experiments or simulations are to be compared with the experimental data for validation. After that, they are used to make new predictions about natural phenomena. This saves us a lot of human time with no safety issues as often is the case in “wet lab” experiments. Molecular simulations have limitations and will probably never be able to replace wet lab experiments but can serve as a direct supplement to them. Therefore, the two are used in a complementary way to shed light on a wide range of natural phenomena. Today, we focus on a specific type of simulation called Molecular Dynamics (MD). MD simply simulates the time-dependent motion of molecules based on Newtonian mechanics. For biomolecules, you can imagine it like a biological microscope with a resolution of an angstrom (1x10^-10 meters!). Since a typical chemical bond length is about 1 angstrom, MD simulations can show how all atoms move: A real-time biological movie! 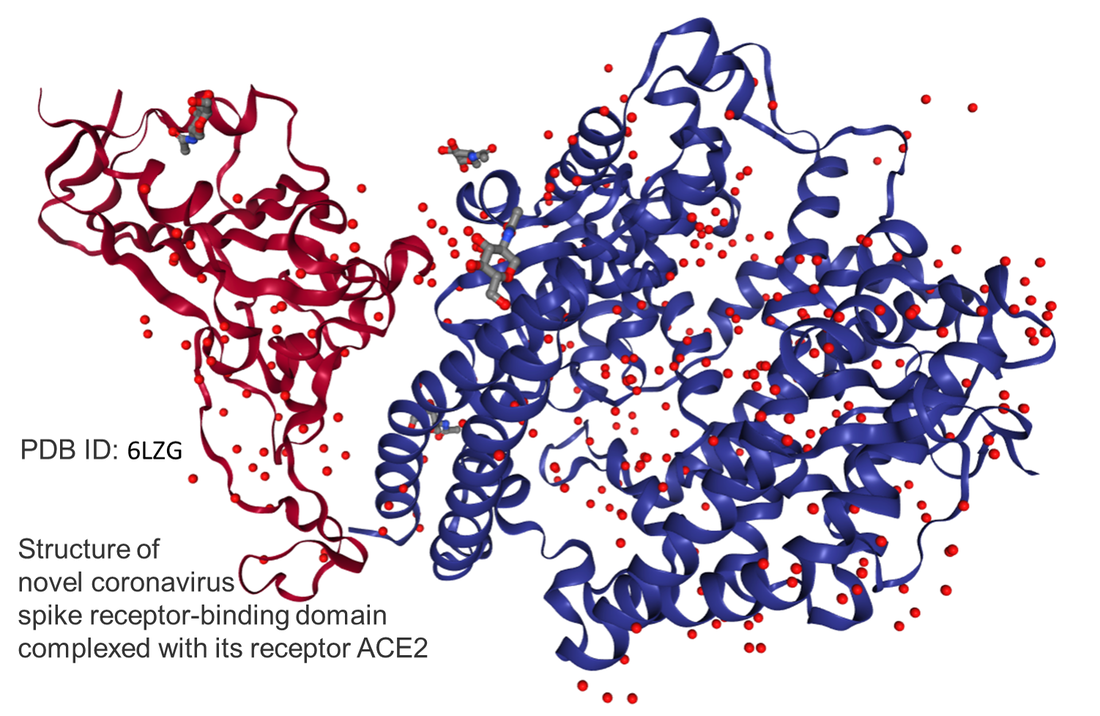 Since the beginning of the outbreak, the experimentalists have been working hard to reveal as much structural information as possible related to SARS-CoV-2 (the virus that causes COVID-19). By the way, here is a good summary regarding how to name this human coronavirus. Anyway, yes, we have lots of structural information already available in the protein databank. However, they are static (snapshot-like) 3D structures. Although they provide a lot of useful information, to find the druggable sites or understand the mechanism of entry to the body, motion of the virus proteins will be invaluable. In the past, MD simulations captured motions that create potentially druggable sites in numerous proteins including the Ebola protein. Also, keep in mind that the experimental structure itself is a must information for MD simulations to start with. Therefore, the experiment and computation go hand in hand!
We hope this gives you some insights regarding the molecular simulations. Drop a comment below to continue the discussion!
0 Comments
BY: EKREM KAYA With the coronavirus pandemic taking the world by storm, COVID-19 gets closer to home every second. With over 15,129 reported cases of the virus in the United States, the virus has become hard to track. Luckily health organizations and other outlets have made tracking the pandemic easier for the public with detailed, up to date, maps. We’ve gathered a short list of reliable online maps to help inform the public and prevent misinformation.  World Health Organization’s Novel Coronavirus Situation
As the main source of corona updates for most of the world, the WHO has gathered their info in a generic map. Their data, reported straight by national authorities, is as reliable as it gets. This map lists the number of cases for every country and even shows the date last updates per nation or territory. Nextstrain Genomic Epidemiology of Novel Coronavirus (hCoV-19) Nextstrain provides an extremely interactive map with tons of useful features for you to explore. The dashboard features a diverse pool of information contributed by different labs and authors. It’s available in multiple languages and even has an animation feature to help visualize the spread of this deadly virus. The website is a free open source tool for the entire community Coronavirus Interactive Web-based Dashboard by Johns Hopkins University Another map tracking COVID-19 with much detail, JHU’s map takes in data from WHO, CDC, ECDC, and many more. This map tracks all active cases as well as all cases of recovery from COVID-19. The dashboard also includes graphs and charts for a visual way to track the spread of the virus. By now, we all agree that COVID-19 is to be taken seriously and precautions must be taken to stop the spread of the virus. Here’s CDC’s official page and here’s their tips on how to prepare. You can also check the proximity of the virus at the following link(source non-official). |
Quest Student Research InstituteOn Science, Computation, Medicine, and Academic Success Archives
January 2022
|
 RSS Feed